
Where is Jeff Samardzija’s Career Headed?

A year ago, it seemed that when the 2015 free agent market opened up, Jeff Samardzija was going to compete with guys like Jordan Zimmerman, Doug Fister and Yovanni Gallardo for the second-tier contracts behind the three “aces” that would be on the market (David Price, Zack Greinke, Johnny Cueto). Some might have even argued that after a 2014 campaign where he posted a 2.99 ERA with the Cubs and Athletics, Samardzija was potentially in line to get “ace” money, especially from an NL club. Jeff did just about everything he could this season to shoot down any of that talk, posting an ERA close to 5.00 with the Chicago White Sox in 32 starts.
What’s interesting about Samardzija’s season is that it wasn’t all bad. He still pitched over 210 innings for the third year in a row, and was second in the MLB with 2 shutouts. His BB/9 was higher than 2014 but lower than career average as well. Unfortunately, that’s about where the good news ends. He led the majors in hits and earned runs allowed, and was tied for the AL lead in home runs allowed. His K/9 was (way) down, his strand rate (LOB%) was down, his GB% was (way) down, and even by FIP he was about a run and a half worse than he had been the rest of his career.
The first thing that sticks out about this season in particular is that Samardzija was generally very easy to score runs off of, but he still managed to amass a large number of innings. I suspected that posting an ERA near 5.00 and still managing to toss 200+ innings was a rarity, but a Play Index search showed me that since 2000, there were 25 other players to do that in the MLB – an interesting find. However, most of those guys were in the early 2000’s when the steroid problem was still markedly effecting the overall offensive production of baseball as a whole. Therefore, I adjusted my search to see how many pitchers in that time frame posted seasons with ERA+ worse than Samardzija’s and still accrued more than 200 innings – this search was more telling, and you can see the results below:
| Player | GS | IP | Year | Age | Tm | Lg | G | CG | SHO | GF | W | L | SV | H | R | ER | BB | SO | HR | 2B | 3B | IBB | HBP | SH | SF | GDP | |||||||||
|---|---|---|---|---|---|---|---|---|---|---|---|---|---|---|---|---|---|---|---|---|---|---|---|---|---|---|---|---|---|---|---|---|---|---|---|
| Ryan Dempster | 5.38 | 77 | 33 | 209.0 | 2002 | 25 | TOT | NL | 33 | 4 | 0 | 0 | 10 | 13 | .435 | 0 | 228 | 127 | 125 | 93 | 153 | 4.72 | 28 | 42 | 11 | 2 | 10 | 9 | 6 | 23 | .286 | .365 | .472 | .837 | 124 |
| Brett Tomko | 5.28 | 78 | 32 | 202.2 | 2003 | 30 | STL | NL | 33 | 2 | 0 | 0 | 13 | 9 | .591 | 0 | 252 | 126 | 119 | 57 | 114 | 5.07 | 35 | 54 | 6 | 2 | 5 | 12 | 3 | 15 | .305 | .353 | .513 | .866 | 131 |
| Livan Hernandez | 5.24 | 76 | 34 | 226.2 | 2001 | 26 | SFG | NL | 34 | 2 | 0 | 0 | 13 | 15 | .464 | 0 | 266 | 143 | 132 | 85 | 138 | 4.37 | 24 | 50 | 10 | 7 | 3 | 12 | 12 | 22 | .297 | .356 | .456 | .812 | 120 |
| James Shields | 5.18 | 75 | 33 | 203.1 | 2010 | 28 | TBR | AL | 34 | 0 | 0 | 0 | 13 | 15 | .464 | 0 | 246 | 128 | 117 | 51 | 187 | 4.24 | 34 | 50 | 6 | 2 | 5 | 5 | 2 | 14 | .294 | .338 | .490 | .828 | 128 |
| Jeff Samardzija | 4.96 | 79 | 32 | 214.0 | 2015 | 30 | CHW | AL | 32 | 2 | 2 | 0 | 11 | 13 | .458 | 0 | 228 | 122 | 118 | 49 | 163 | 4.23 | 29 | 40 | 9 | 0 | 12 | 4 | 9 | 17 | .273 | .319 | .446 | .765 | 112 |
| Justin Masterson | 4.93 | 79 | 34 | 206.1 | 2012 | 27 | CLE | AL | 34 | 1 | 0 | 0 | 11 | 15 | .423 | 0 | 212 | 122 | 113 | 88 | 159 | 4.16 | 18 | 36 | 2 | 1 | 13 | 6 | 11 | 26 | .269 | .348 | .388 | .736 | 108 |
That’s some pretty exclusive company. Samardzija was just the third player since 2010 to perform so poorly – relative to league average – and still pitch so many innings.
So, while the surface numbers show that Samardzija’s season was a nightmare, there are some things that might point us toward believing he is definitely not as bad as the past season shows. One of those things is his performance in prior seasons, which (especially in 2014) was quite good. Below are Jeff’s stats for his major league career:
| Year | Age | Tm | Lg | W | L | G | GS | GF | CG | SHO | SV | IP | H | R | ER | HR | BB | IBB | SO | HBP | WP | ||||||||||
|---|---|---|---|---|---|---|---|---|---|---|---|---|---|---|---|---|---|---|---|---|---|---|---|---|---|---|---|---|---|---|---|
| 2008 | 23 | CHC | NL | 1 | 0 | 1.000 | 2.28 | 26 | 0 | 6 | 0 | 0 | 1 | 27.2 | 24 | 12 | 7 | 0 | 15 | 2 | 25 | 1 | 2 | 202 | 3.06 | 1.410 | 7.8 | 0.0 | 4.9 | 8.1 | 1.67 |
| 2009 | 24 | CHC | NL | 1 | 3 | .250 | 7.53 | 20 | 2 | 7 | 0 | 0 | 0 | 34.2 | 46 | 29 | 29 | 7 | 15 | 1 | 21 | 1 | 2 | 60 | 5.90 | 1.760 | 11.9 | 1.8 | 3.9 | 5.5 | 1.40 |
| 2010 | 25 | CHC | NL | 2 | 2 | .500 | 8.38 | 7 | 3 | 0 | 0 | 0 | 0 | 19.1 | 21 | 22 | 18 | 4 | 20 | 1 | 9 | 2 | 1 | 51 | 8.25 | 2.121 | 9.8 | 1.9 | 9.3 | 4.2 | 0.45 |
| 2011 | 26 | CHC | NL | 8 | 4 | .667 | 2.97 | 75 | 0 | 18 | 0 | 0 | 0 | 88.0 | 64 | 35 | 29 | 5 | 50 | 3 | 87 | 5 | 8 | 132 | 3.66 | 1.295 | 6.5 | 0.5 | 5.1 | 8.9 | 1.74 |
| 2012 | 27 | CHC | NL | 9 | 13 | .409 | 3.81 | 28 | 28 | 0 | 1 | 0 | 0 | 174.2 | 157 | 79 | 74 | 20 | 56 | 2 | 180 | 4 | 10 | 107 | 3.55 | 1.219 | 8.1 | 1.0 | 2.9 | 9.3 | 3.21 |
| 2013 | 28 | CHC | NL | 8 | 13 | .381 | 4.34 | 33 | 33 | 0 | 2 | 1 | 0 | 213.2 | 210 | 109 | 103 | 25 | 78 | 3 | 214 | 8 | 11 | 89 | 3.77 | 1.348 | 8.8 | 1.1 | 3.3 | 9.0 | 2.74 |
| 2014 ★ | 29 | TOT | MLB | 7 | 13 | .350 | 2.99 | 33 | 33 | 0 | 2 | 0 | 0 | 219.2 | 191 | 86 | 73 | 20 | 43 | 3 | 202 | 10 | 10 | 125 | 3.20 | 1.065 | 7.8 | 0.8 | 1.8 | 8.3 | 4.70 |
| 2014 | 29 | CHC | NL | 2 | 7 | .222 | 2.83 | 17 | 17 | 0 | 0 | 0 | 0 | 108.0 | 99 | 44 | 34 | 7 | 31 | 3 | 103 | 6 | 6 | 134 | 3.09 | 1.204 | 8.3 | 0.6 | 2.6 | 8.6 | 3.32 |
| 2014 | 29 | OAK | AL | 5 | 6 | .455 | 3.14 | 16 | 16 | 0 | 2 | 0 | 0 | 111.2 | 92 | 42 | 39 | 13 | 12 | 0 | 99 | 4 | 4 | 118 | 3.30 | 0.931 | 7.4 | 1.0 | 1.0 | 8.0 | 8.25 |
| 2015 | 30 | CHW | AL | 11 | 13 | .458 | 4.96 | 32 | 32 | 0 | 2 | 2 | 0 | 214.0 | 228 | 122 | 118 | 29 | 49 | 0 | 163 | 12 | 5 | 79 | 4.23 | 1.294 | 9.6 | 1.2 | 2.1 | 6.9 | 3.33 |
| 8 Yrs | 47 | 61 | .435 | 4.09 | 254 | 131 | 31 | 7 | 3 | 1 | 991.2 | 941 | 494 | 451 | 110 | 326 | 15 | 901 | 43 | 49 | 96 | 3.84 | 1.278 | 8.5 | 1.0 | 3.0 | 8.2 | 2.76 | |||
Definitely inconsistent and tough to evaluate as a whole, but we can make it a bit easier on ourselves pretty simply. From 2008 to 2010, Samardzija was bouncing around between the big club and the minors and pitched fewer than 40 innings each year. In 2011, Samardzija was on the MLB club for the whole year but was exclusively a reliever. As we have seen with guys like Wade Davis, there are huge differences between starting and reliever that can effect performance in a number of ways. Lastly, looking at the splits between Chicago and Oakland in 2014 is relatively fruitless, as we see that the only major difference between the two is his HR/9. Therefore I’d like to focus on 2012-2015, full seasons only. Here’s was that looks like:
| Year | Age | Tm | Lg | W | L | G | GS | GF | CG | SHO | SV | IP | H | R | ER | HR | BB | IBB | SO | HBP | WP | ||||||||||
|---|---|---|---|---|---|---|---|---|---|---|---|---|---|---|---|---|---|---|---|---|---|---|---|---|---|---|---|---|---|---|---|
| 2012 | 27 | CHC | NL | 9 | 13 | .409 | 3.81 | 28 | 28 | 0 | 1 | 0 | 0 | 174.2 | 157 | 79 | 74 | 20 | 56 | 2 | 180 | 4 | 10 | 107 | 3.55 | 1.219 | 8.1 | 1.0 | 2.9 | 9.3 | 3.21 |
| 2013 | 28 | CHC | NL | 8 | 13 | .381 | 4.34 | 33 | 33 | 0 | 2 | 1 | 0 | 213.2 | 210 | 109 | 103 | 25 | 78 | 3 | 214 | 8 | 11 | 89 | 3.77 | 1.348 | 8.8 | 1.1 | 3.3 | 9.0 | 2.74 |
| 2014 ★ | 29 | TOT | MLB | 7 | 13 | .350 | 2.99 | 33 | 33 | 0 | 2 | 0 | 0 | 219.2 | 191 | 86 | 73 | 20 | 43 | 3 | 202 | 10 | 10 | 125 | 3.20 | 1.065 | 7.8 | 0.8 | 1.8 | 8.3 | 4.70 |
| 2015 | 30 | CHW | AL | 11 | 13 | .458 | 4.96 | 32 | 32 | 0 | 2 | 2 | 0 | 214.0 | 228 | 122 | 118 | 29 | 49 | 0 | 163 | 12 | 5 | 79 | 4.23 | 1.294 | 9.6 | 1.2 | 2.1 | 6.9 | 3.33 |
Ahh, much better. At least, much simpler. Still, we have quite the task ahead determining what all of this means. As you can see, we have in front of us one mediocre season, one poor one, one excellent one, and one awful one. So, where does he go next? The easiest route to figuring that out is comparing what happened in 2015 and seeing if it was simply a terrible streak of bad performance and luck, or a trend of Samardzija’s regression as a pitcher.
Going into his age 31 season, it is fair to wonder if some of what happened last year is Samardzija’s age catching up to him. Generally, this means that a pitcher is losing velocity or movement on his pitches. Somewhat surprisingly, however, in a season where Samardzija performed nearly two full runs worse than the year before, his velocity and movement was relatively consistent across all five of his pitches (four-seam, two-seam, slider, splitter, cutter).So, this wasn’t an issue of his stuff degrading too much.
Nextwe could examine Samardzija’s command – while it’s easy to look and say that his walk rates weren’t far worse than they were in any other year, that doesn’t tell us where the pitches in the strike zone are ending up. Here’s a look at the heatmaps of Samardzija’s pitches, first in 2014, then in 2015 (funny thing I learned from doing this – Samardzija threw exactly the same number of pitches in 2014 and 2015, with 3339, something I had to verify via FanGraphs).
Jeff Samardzija, All Pitches, 2014:
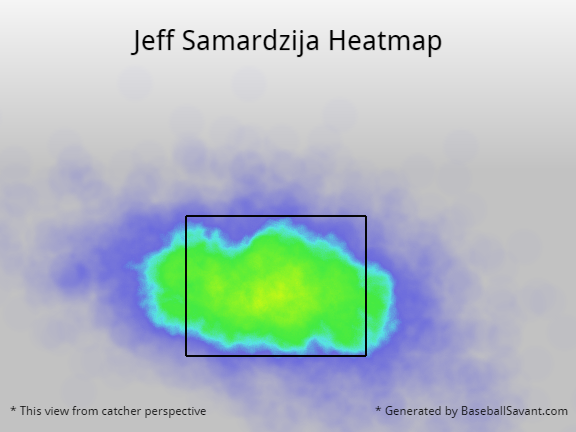
Jeff Samardzija, All Pitches, 2015:

This is the first of our clues as to what went wrong in 2015, and what needs to improve going forward. Samardzija was far and away much better at commanding the edges of the plate in 2014, which is clearly a factor in why he had such good success that year. Contrarily, Samardzija struggled to command the corners in 2015. It’s easy to see that he hardly ever threw to his arm side (inside to RHH) and missed to his off the plate glove side far more often. The faint yellow patch in the graph, which is the most common location, is visibly higher and more concentrated in 2015 than in 2014, which indicates that Samardzija was leaving pitches up in the zone where they could be hit harder.
Actually, that last sentence was something of a misdirection. According to FanGraphs, in 2015 Samardzija didn’t get hit significantly harder than he had in 2014 and we pretty much on par with his career averages. Here are Samardzija’s Soft/Med/Hard hit ball rates, for the last two years as well as his career as a whole:
2014: 19.9/55.4/24.7
2015: 18./54.7/26.7
Career: 18.8/54.7/26.5
So, now we might be wondering a bit – if his command was poor, but he didn’t get hit harder, what happened?
When we look at the batted ball data, it becomes quite obvious what happened. As everyone knows, pitchers love ground balls because ground balls are easy outs. Samardzija’s primary pitch is his four-seam, but nearly all his secondary pitches – two-seam, cutter, splitter especially – are typical “ground ball pitches”. It’s not surprising then to see that from 2011-2014, Jeff’s ground ball rates increased every year, from 41.0% in 2011 to 50.2% in 2014. What is surprising is when then happened in 2015 – an astonishingly low 39.0% ground ball rate, lowest of his career excluding 2010 (when he pitched a whopping 19.1 innings and amassed a 9:20 K:BB ratio, and no, that isn’t backwards). Since fewer ground balls got hit, Samardzija allowed more line drives and far more fly balls in 2015. His fly ball rate took a huge jump from 30.5% to 39.8%, which was very troublesome, seeing as his HR/FB% stayed relatively stagnant at 10.8% (it was 10.6% in 2014). Due to the fact that hitters were more able to elevate the ball off of Samardzija in 2015, hit BABIP against jumped 20 points from .283 to .303. Part of this can be explained by chance and the range of the defenders behind him, but it’s assuredly also influenced by the batters hitting the ball better.
So, what does this mean for Samardzija’s future? Simply, he needs to find the command of the corners and the bottom half of the zone that he once had. This will lead to him getting more of the ground balls he loves and keep him away from the fly balls that hurt him so badly, as well as possibly reviving his low K%. I believe that it’s not a horribly tough task, but the fact that he struggled with it so mightily in 2015 is concerning. Realistically, I think Samardzija is certainly due to progress back towards where he was in 2014. It would seem that his GB% was really an anomaly this season, and if it gets back even close to where it was in 2013/2014, he would benefit greatly.
FanGraphs/Steamer projects Samardzija to pitch to a 3.85 ERA/3.88 FIP over an even 200.0 IP in 2016, which I believe is reasonable. Baseball-Reference is a bit more pessimistic, projecting a 4.19 ERA in 189.0 IP. I think it’s a bit too early to tell, as Samardzija doesn’t have a team as it stands right now. The Cubs and Yankees have been rumored to be interested, but I’d be hard-pressed to believe a guy who struggles with the longball would want to pitch at Yankee Stadium. To conclude, I think Samardzija had some bad command and bad luck in 2015, but he likely won’t ever be as good as he was in 2014 again. Look for Samardzija to be a serviceable #2-#3 starter next year, most likely eating another 200 innings and posting an ERA between 3.50 and 4.00. While that’s not what we all thought a year ago, it’d sure be an upgrade from where he was this season.
Credit goes to Baseball-Reference, FanGraphs, and Baseball Savant for statistics on this article. Having a bit of trouble with player links right now but that will be fixed as soon as possible. Thanks!

Регистрация
LikeLike