
The Pitching Series: Velocity

Over the course of the history of baseball, one thing that has always caught the eye of observers is a pitcher with a great fastball. Even as early as the turn of the 20th century, pitchers with impressive velocity were always demanding attention. “He throws so fast you can’t see ’em,” one scout said of Walter Johnson in 1907, “and he knows where he is throwing, because if he didn’t there would be dead bodies strewn all over Idaho.” Johnson went on to compile 417 wins and 3,509 strikeouts over his 21 year MLB career (all spent with the Washington Senators). Nowadays, pitchers with great velocity are a dime-a-dozen, but there are still some pitchers who can set themselves apart, like Aroldis Chapman. The “Cuban Missile” has more 100+ MPH pitches than the rest of the MLB does since he entered the league in 2010, with his fastest pitch being recorded at 105.1 MPH according to PitchF/X. Chapman, like Johnson, has enjoyed tremendous success in the MLB, racking up 146 saves in 6 seasons (4 seasons as a closer) along with a 2.17 ERA (coincidentally, the same as Johnson’s) and 546 K, good for a career K/9 of 15.4.
However, great velocity doesn’t always translate to great success. Many of you may not know the story of a man from Connecticut named Steve Dalkowski. Steve was signed out of high school by the Baltimore Orioles in 1957. Dalkowski’s fastball was the stuff of legend. Some estimated his fastball could reach up to 110 MPH, and Hall of Fame manager Earl Weaver said Dalkowski’s was the hardest fastball he’d ever seen. However, Dalkowski was unable to harness the power of his incredible heater, finishing his 9-year minor league career with an astounding 1,354 walks in just 970 IP. He also struck out 1,396 batters but finished his career with an ERA near 6.00 and never made it above AAA.
So, one may be left with the desire to find out just how much a great fastball – no, a fast fastball – leads to major league success, in today’s game. Some may argue that, of course, throwing harder makes you better. Look at how many successful flamethrowers there are in today’s game – Matt Harvey, Jacob deGrom, Gerrit Cole, Stephen Strasburg, Chris Archer, Yordano Ventura – the list goes on and on, especially when you start looking at relievers (Chapman, Ken Giles, Kelvin Herrera, Craig Kimbrel, etc.). So, let’s look at how velocity related to ERA among the MLB’s 78 qualified starters in 2015:

Interesting. While the trendline indicates that ERA generally decreases as velocity increases, we can see that there’s really no hard correlation between the two variables. In fact, a little statistics work shows us that the coefficient of correlation (R) is about -0.25 (0.0-0.5 is weak, 0.5-0.8 is average, 0.8-1.0 is strong – negative indicates an inverse relationship, but -1.0 is just as strong a correlation as 1.0). By looking at the individual points, we see that the starter with the highest average fastball velocity has ab ERA above 4.00 (Ventura) while there are 3 pitchers below 87 MPH with ERAs below 4.00, and even one pitcher below 90 MPH with an ERA below 2.50 (Dallas Keuchel). So, some people nowadays (myself included) like more in-depth statistics when valuing a pitcher. So, let’s look at how velocity relates to FIP:

Okay, so this is a little more telling. Here we see that the data is more tightly grouped and has a bit more downward slope to it. Still, our R is just -0.46, which is better than our ERA graph but still weak. This may be because pitchers with high velocity have better peripherals that play into having a good FIP (low HRs, high Ks). What if we wanted to include balls in play, instead of just looking at the TTO (three true outcomes) results of a pitcher? Let’s have a look at one more metric, SIERA:
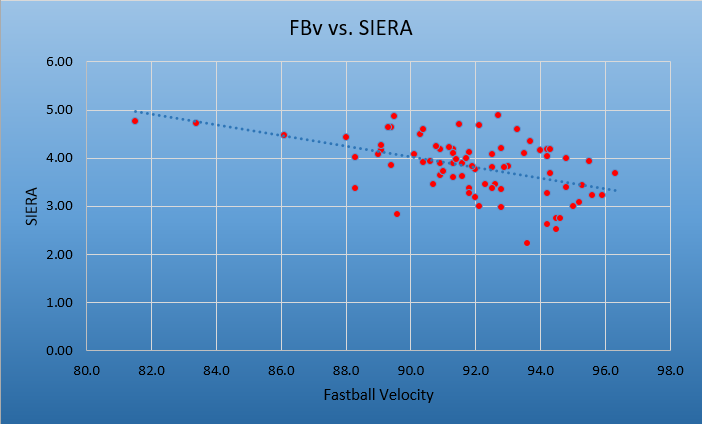
So SIERA is a lot like FIP, but as I mentioned before, it factors in balls put into play. The graph looks pretty darn similar to the one with FIP, and also has a similar R: -0.49, almost into the “average” range, but still weak. So even when incorporating batted-ball data with SIERA, we haven’t seen that velocity has a definite correlation with success. So, a new question emerges – what are the things that a hard fastball does give you an advantage on? What about a disadvantage?
The first thing that comes to mind when thinking about hard-throwing pitchers is strikeouts. Theoretically. the harder you throw the ball, the harder it is to hit. Of course, having a great curveball or changeup can be just as devastating as a 98 MPH fastball when you get two strikes on a hitter. Regardless, let’s take a look at how fastball velocity relates to strikeout percentage:
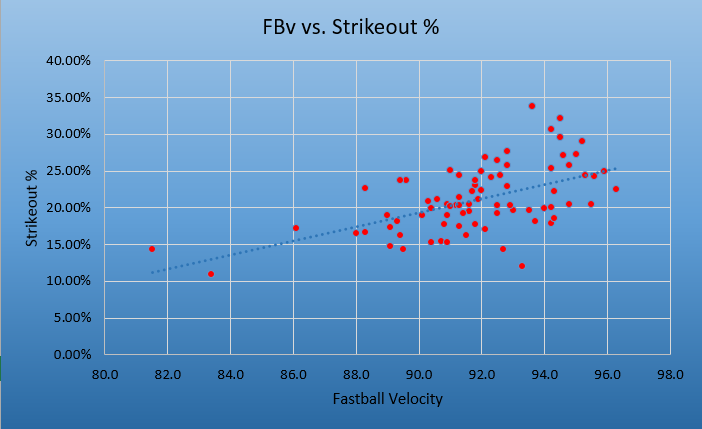 Here we see a bit more correlation, which isn’t very surprising. It makes sense, just by the nature of the game, that harder throwers will get more strikeouts. However, we also often think of hard throwers as being more wild, and walking more batters. We’ll take a look at that idea as well:

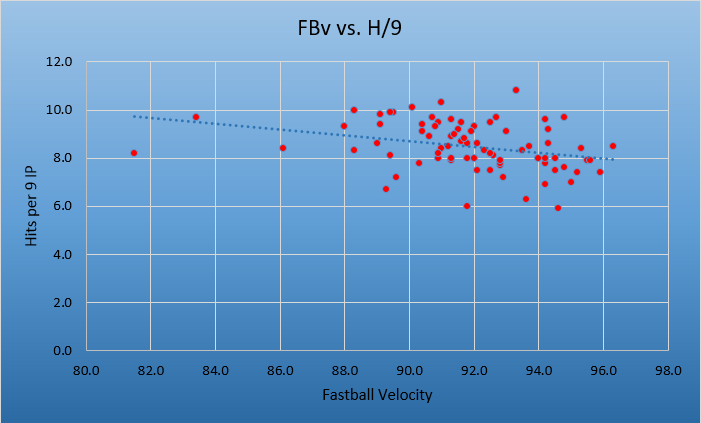
Well, that’s about all we need to disprove that theory. There’s almost no correlation here, with an R value of 0.09. So when it comes to strikeouts and walks, it seems that high-velocity pitchers have the advantage, striking out more hitters without walking more (generally). What about balls in play – do harder throwers give up fewer hits?
While it may not appear too conclusive, the R of this data is -0.30, which is still weak but indicates at least some degree of correlation. If we were to eliminate a few choice outliers, we would see a stronger correlation in both the graph and the correlation coefficient.
So, to sum up what we’ve uncovered so far: high-velocity pitchers strike out more batters, give up fewer hits, and don’t walk more batters – but they don’t have an advantage when it comes to ERA. However, FIP and SIERA both favor harder throwers. So what causes the discrepancy between the actual results and the projected results? In other words, what do hard-throwers do worse that seems to be the “equalizer” when it comes to actual ERA?
In short, nothing really. While there are a few things that hard-throwers have an advantage in, there’s really nothing that disadvantages them as a whole. When looking at zone discipline data, the best correlation we see is between contact rates and fastball velocity. Not surprisingly, batters make less contact on pitchers with hard fastballs, especially on pitches out of the zone. I hypothesized that maybe this meant harder throwers get hit harder, but a quick Baseball Savant search proved me wrong in that regard. BABIP, HR/FB%, FB%, GB%, HR/9 – nothing. I tested around 30 different rate stats, metrics, anything I thought might prove worthwhile, and none had any correlation that would indicate significance.
So, then, why doesn’t success increase as fastball velocity does? Simply put, at the end of the day strikeouts and hits alone don’t dictate the success of a pitcher. While they are important parts of pitching, there are so many factors at play that influence a pitcher’s success, even some that are out of his control. While throwing hard is a great way to garner attention from scouts and fans, it’s not a surefire way to success in the major leagues. Individual pitchers have strengths and weaknesses which make them successful outside of how fast their fastballs are – most starters throw three or even four secondary pitches, anyway. So next time you hear about your favorite team signing or drafting a guy with a 99 MPH fastball, don’t get too excited. Being a successful MLB pitcher is much more complicated than simply lighting up the gun.
Next in my “Pitching Series”, I’ll examine pitchers with great control. It’ll be a bit more subjective than this article, as there’s far more at play than simply a number on a radar gun.
If you are interested in a particular statistic as it pertains to a pitcher’s velocity that I didn’t mention in this post, leave me a comment below and I’ll take a look at it. Thanks!
All of my statistics are taken from Baseball-Reference, FanGraphs, Baseball Savant, and Brooks Baseball.
Thanks for reading and be sure to check back in later this week for Part Two!

Matt, good stuff. I wonder how stats like xFIP, rvERA, chase rate, swing & miss rate, batted ball distances, HR/FB or HRs allowed among some other defense independent stats vary as velo increases. I often don’t like using stats like hits allowed, FIP, ERA and some others because they still have some defense dependency in them. Having some of the defense independent stats included could better isolate and support your argument. I’m skeptical that velo doesn’t matter however since batting avg of FBs goes down as the velocity goes up from about 91mph on. Since 2008 90 & 91 MPH are the hardest hit pitch and has the highest batting avg however, as you increase from there batting avg decreases same with slugging %. While lg batting avg is low for velocities lower than 90 I believe that would be due to the fact they include all types of pitches so you could rule out that low velocity is just as good high velocity on the FB.
LikeLike
Ryan, a few responses:
First let me address your question of how velocity relates to xFIP, chase rate, whiff rate, and HR/FB. With regards to xFIP, it’s pretty much the same as FIP and SIERA (R=-0.489), so pretty weak. Chase rate is even less closely related (R=0.292), and whiff rate is right back in the same area (R=0.512). HR/FB has almost no relationship with fastball velocity (R=-0.073).
I agree that using simple stats like hits and ERA is “outdated” so to speak, but it’s worth looking at as long as you know that some of the results in that case are going to be out of the pitcher’s control.
As for FIP, I think you may be confused – FIP incorporates only HR, K, BB, and HBP in its formula (check it out here: http://www.fangraphs.com/library/pitching/fip/) so it’s pretty much as “fielding independent” as it gets. xFIP simply takes this formula and adjusts the HR number for what the pitcher “should have” allowed, based on league HR/FB% as well as the pitcher’s FB%. SIERA incorporates more batted-ball components, which I think is valuable as long as you know the context.
As for the BAA and SLG arguments, I agree with you. My argument isn’t that velo doesn’t matter with regards to a fastball only. In other words, I definitely agree that a 96 MPH fastball is better than a 90 MPH fastball (in MOST cases – looking at you, Nate Eovaldi) for multiple reasons. However, is a pitcher with a 96 MPH fastball necessarily better than a pitcher with a 90 MPH fastball? I think not, and that’s more the conclusion I was getting at.
Thanks for the reply!
LikeLike
Pingback: The Pitching Series: Efficiency | Ball Eight
Pingback: Thoughts one week before pitchers and catchers report to Spring Training – River Avenue Blues - reffnews
Hey Matt,
Very cool article and it looks like this took a lot of work and I applaud you for that. When looking at the FBv vs ERA graph, it appears as if there are 3 points that seem to be outliers in the graph. They are about 81 mph, 83 mph, and 86 mph. I am just eyeballing it, but it does seem like it can be pulling the regression line a bit. Are you able to remove those points and any other outlier and run another regression line with a new R factor?
LikeLike
adorable! Record-Breaking Heatwave Hits Europe 2025 graceful
LikeLike