
Joc Pederson and the Terrible, Horrible, No Good, Very Bad Half

Prior to the 2015 MLB season, the Dodgers dealt Matt Kemp to the Padres along with C Tim Federowicz in return for C Yasmani Grandal and RHPs Joe Wieland and Zach Eflin.
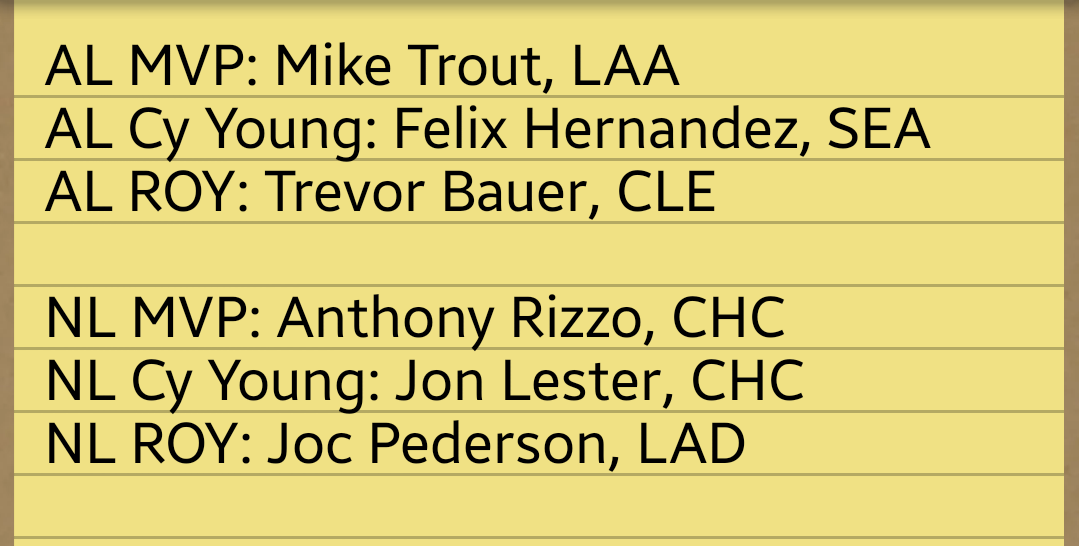
Part of the rationale for this trade was the Dodgers’ abundance of talent in the outfield, with players like Carl Crawford, Andre Ethier, Yasiel Puig, and Scott Van Slyke. Also among those vying for a job in the outfield in Chavez Ravine was 22-year-old Joc Pederson, a native of Palo Alto, CA and the Dodgers’ 11th round draft pick in 2010. Pederson first appeared in the bigs in 2014, posting a .143 BA in 38 PA, going 4-for-28 but walking nine times against eleven strikeouts. However, the left-handed hitting Pederson was highly touted coming up through the minors, hitting 84 career minor-league HR, including 33 at AAA in 2014. In the same season, he posted a 100/149 BB/K ratio and stole an impressive 30 bases (although he was caught 13 times). All things considered, there were high expectations for Pederson this year, and in March I even picked him to win the NL ROY award:
Pederson looked like he was adjusting to being a full-time MLB centerfielder pretty well in the first half, playing just about average to below-average defense in centerfield and hitting quite well, despite his average dropping significantly from where it had been over his minor league career (.302 to .230). Despite the low batting average, Pederson was getting on base quite often (.364 OBP) thanks to his high walk rate (15.8%) and hitting for lots of power, with 15 doubles and 20 home runs in 366 PA before the All-Star break. However, after the break, something changed in Pederson’s swing that lead to disastrous results in the second half.
After the break, Pederson managed to hit just .178 over his final 219 PA, hitting just six more home runs and four more doubles. While he wasn’t an RBI machine in the first half (40), he drove in all of 14 runs in the second half. His slugging percentage dropped precipitously, plunging nearly 200 points from .487 to an even .300 – to put this in perspective, Paul Konerko slugged .487 for his career, and .300 is the career slugging percentage of Madison Bumgarner. So, over the course of four days in July, Pederson went from having the slugging prowess of a man with 439 career HR over 18 MLB season, to that of a pitcher who struck Pederson out 3 times this year (in 8 PA)! Clearly, there was more to this than simply a “slump” – Pederson was a completely different player, in terms of production, from the first half to the second.
To find out what might have caused such a dropoff in production, we can start by looking the splits from the first half compared to the second half. Interestingly enough, Pederson’s walk and strikeout rates from the first and second halves were nearly identical – 15.8% to 15.5%, and 29.2% to 28.8%. Pederson’s BB/K ratio was exactly identical, at 0.54 for both halves. So while Joc’s offensive production plummeted, he continued to strike out and walk at nearly exactly the same pace as he had been. This basically means he also put the ball in play at essentially the same rate as before. So, drawing off of these facts, it’s pretty easy to conclude that Pederson’s struggles arose from the way he put the ball in play.
The most simple batted-ball statistic we have is BABIP, so we can look at that first. Interestingly, Pederson already had a below-average BABIP in the first half at .282 (league average for 2015 was .299). As the critical thinkers in our audience have already concluded (because BA went down and BB%/K% stayed the same), Pederson’s BABIP must’ve taken a significant hit in the second half. Sure enough, Pederson’s .232 mark in the second half was much lower than his already below-average first-half number. Next, it’d be nice to try and find out a) why, beyond bad luck, did Pederson’s BABIP suffer so badly, and b) why did Pederson’s slugging numbers drop so much, disproportionately even to his average?
Luckily, it would seem that each of those questions might be answered with one piece of information: Joc wasn’t hitting the ball nearly the same way he was in the first half, in two ways. First, he was hitting the ball a lot softer than he was before the All-Star break. FanGraphs breaks batted balls into three categories based on exit velocity – soft, medium, and hard. In the first half, 14.9% of Joc’s batted balls fell into the “soft” category, 43.6% fell into the “medium” category, and 41.5% fell into the “hard” category. In the second half, those numbers were 29.4%, 40.3% and 30.3%, respectively. To quantify this data, he averaged 93.5 MPH exit velocity in the first half, and 89.3 MPH in the second half, dropping over 4 MPH. Pederson also hit far more balls to the opposite field in the second half, with his pull/middle/away rates changing from 45.1%/36.9%/18.0% in the first half to 41.2%/31.1%/27.7% in the second half – a significant shift in where Pederson was hitting the ball. So, finally, it might be a good idea to explore just why Pederson started hitting the ball worse in the second half.
Struggles, when it comes to hitting, come from either external or internal sources. Internal sources could be mental or physical, but it lies within the batter’s fault and control. Pederson didn’t make any huge adjustments to his swing in the second half, but Pederson did say his “feel” wasn’t always there. “When you break it down (first half and second half), it’s not the same. My body position. Getting to an athletic hitting position is something I need to get better at,” Pederson commented. He also acknowledged that he opened his stance at some point in order to try and improve his results, but found it tough to make other adjustments. This leads me to believe that outside of Pederson lacking his “feel” at the plate, that his struggles were largely due to the pitchers he was facing making adjustments better than he did.
First we can look at the types of pitches Pederson saw in the first half, courtesy of Brooks Baseball:

Now, let’s look at the pitches he saw after the break:

This data is a bit inconclusive, as we see that as the All-Star break approached, Pederson saw fewer and fewer fastballs, and more offspeed and breaking pitches. However, after the break, he began to see more fastballs again, but then the trend reverted back as it had and the number of soft pitches increased (data for October is largely irrelevant, as only four games were played). With little to draw from these numbers, we can look at where pitchers were pitching Pederson in the each half, thanks to Baseball Savant. First, before the break:

Next, after the break:
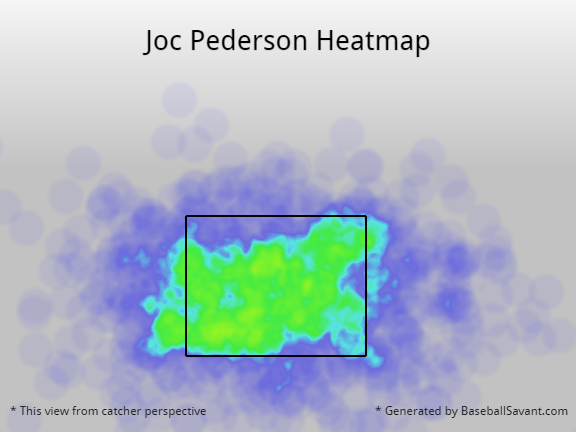
This is what is probably more useful, for our purposes. It would seem that in the second half, pitchers were far more likely to work Pederson inside and challenge him, especially up-and-in. This is likely why Pederson tried to open his stance, as we mentioned, but that probably made him more susceptible to pitches low-and-away, which also saw an increase in usage in the second half. With Pederson off-balance and expecting to be fighting off hard pitches inside, it’s no wonder his exit velocities dropped. With the threat of getting beat inside by hard fastballs, Pederson likely lost his willingness or ability to extend his arms and pull balls like he did in the first half, leading to more balls going the other way (often weakly)
On a good note, it seems that Joc is aware of the adjustments being made against him and did begin to make steps in the right direction in September/October (3 HR, .203 BA, .329 SLG – poor, but better than July/August) of 2015. Additionally, he now has the benefit of an entire offseason to make changes instead of trying to adjust on the fly. With the raw power and good walk ability Pederson shows, Dodgers fans should be optimistic in his ability to be a productive player in 2016 and beyond. With any luck, Pederson’s sophomore slump simply came (and hopefully went) half a season early.
Thanks to Baseball-Reference & the Play Index, FanGraphs, Brooks Baseball, and Baseball Savant for statistics on this article. Additional thanks to Cary Osborne at Dodger Insider for quotes used in this article.

I stopped paying to the Dodgers at some point during the summer (other than Kershaw and Greinke) and assumed he was still in the running for ROY. It was an absolutely stunning drop-off.
LikeLiked by 1 person
Pingback: Joc Pederson and the Nogo Response: the Importance of Physical Consistency – The JailHouse